When we began working on our permaculture design, I started looking around for suitable software to use. The ideal solution would:
- significantly help with the work to be done
- already be in use within the permaculture community, indicating that it’s working well and that there’s a knowledge base to tap into
- ideally, be free and open source.
Vector drawing software such as Inkscape, Adobe Illustrator, or Affinity Designer seems to be most commonly used type for permaculture design. I tried Inkscape, which seemed reasonable for vector drawing but didn’t have anything to make map editing easier.
AutoCAD seems popular with topographers and designers, at least here in Portugal. I don’t know how well it would work for permaculture design – it’s very expensive and thus I never tried it.
I eventually stumbled upon the world of GIS (Geographic Information System) software and tried QGIS, a free and open source GIS software. The first impression was not good: it seemed overwhelmingly complex. I just wanted to draw on a map – why would I need to learn what a “feature” is, never mind be able to pick a feature type for each layer?! Some quick Googling around confirmed: this was a Serious System used by Serious People (that went to school for it) to do Important Things. I moved on.
Google Earth is another tool sometimes mentioned in this context. It has very nice imagery and the historical view is unique. However, the creation and editing features are rudimentary at best for the task at hand.
Time was running out. We needed at least part of a concrete design before the earthworks started. None of the software I had tried had been great but conceptually, QGIS seemed like the right choice. Before delving into it again I read “A Gentle Introduction to GIS” and things started to make sense: it’s a database system, where all the displayed tables are keyed by location.
We started building our design with QGIS, learning on how to use it on the go. In the beginning there’d be frustrating delays trying to do what felt like simple things (e.g. draw a straight line at a fixed distance from another line). There are however many online resources to learn from. If a question can be phrased with the right vocabulary (often tricky in an unknown field) there’s often answers for it on StackExchange.
We started with the survey data from our topographer and Google satellite imagery (later augmented by an aerial photo of the land). Doing the permaculture zone and sector analysis provided more insights, each in its own layer. Our design ideas and specific implementation details are also in layers.
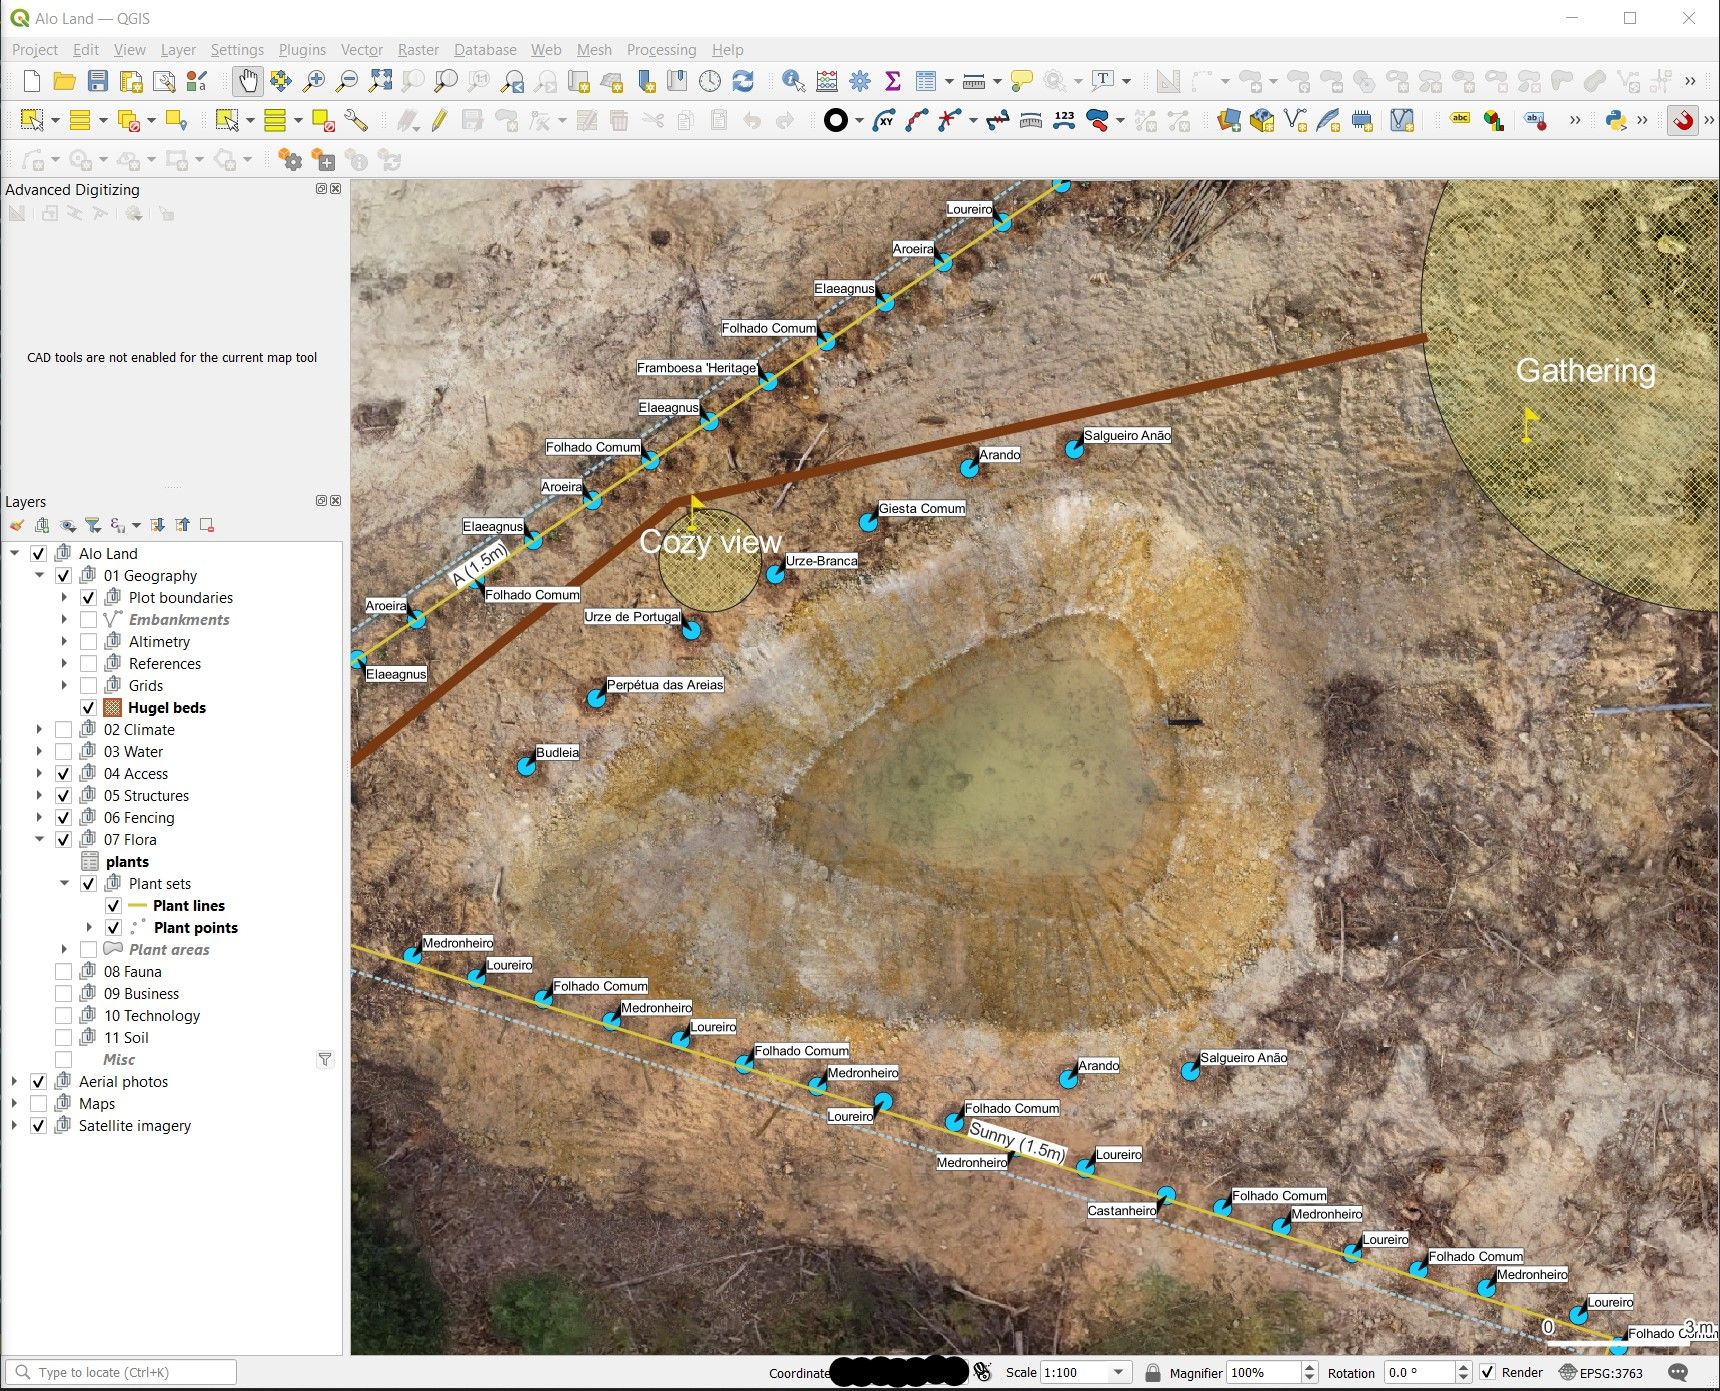
Like for any real world software-based project, the design was not ready by the deadline and the requirements kept changing on the way. We felt confident with our water management design given that we had elevation data, but in practice the terrain was different and we had to adapt on the fly. Neat, curvy planting lines on the map turn out to be difficult to implement in reality. We’re still learning as we go, but the speed has picked up.
QGIS was well worth the initial learning curve and has become an indispensable tool in designing and implementing our permaculture system. In future articles I’ll write about getting good aerial photos and using the GIS project on the field, both important to get the most out of it.